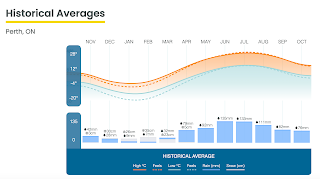
Local data I have collected.
| JAN | 41 | 43 |
| FEB | 45 | 52 |
| MAR | 58 | 7 |
| APR | 66 | 10 |
| MAY | 38 | |
| JUNE | 89 | |
| JULY | 98 | |
| AUG | 37 | |
| SEPT | 106 | |
| OCT | 116 | 0 |
| NOV | 55 | 5 |
| DEC | 65 | 21 |
| 814 | 138 |
Precipitation totals
| JAN | 110 | 41 |
| FEB | 49 | 37 |
| MAR | 67 | 3 |
| APR | 85 | 5.5 |
| MAY | 54 | |
| JUNE | 29 | |
| JULY | 108 | |
| AUG | 179 | |
| SEPT | 65 | |
| OCT | 78 | 0.5 |
| NOV | 81 | 9 |
| DEC | 75 | 15 |
| 980 | 111 |
| 2019 | mm | snow cm |
| JAN | 65 | 64 |
| FEB | 71 | 42 |
| MAR | 72 | 15 |
| APR | 110 | 0 |
| MAY | 88 | |
| JUNE | 101 | |
| JULY | 40 | |
| AUG | 69 | |
| SEPT | 89 | |
| OCT | 166 | |
| NOV | 44 | 30 |
| DEC 7 | 1 | 27 |
| mm 986 | snow 178 |

| 2018 | mm | snow cm |
| JAN | 55.4 | 39 |
| FEB. | 47.8 | 35 |
| MAR | 46.6 | 25.5 |
| APR | 148.0 | 20 |
| MAY | 29.5 | |
| JUN | 72.1 | |
| JUL | 56 | |
| AUG | 48.3 | |
| SEPT | 95.5 | |
| OCT | 71.4 | 7 |
| NOV | 94.0 | 40 |
| DEC | 81.8 | 10 |
| 846.4 | 176.5 |
Zoom Radar weather chasers
It's shocking to have so much rain in January and February. Quite unusual.
| 2017 | mm | snow cm |
| JAN | 31.5 | 40 |
| 5 | 13.7 | 50.8 |
| MAR | 47.8 | 27 |
| APR | 127.5 | |
| MAY | 191.7 | |
| JUN | 88.6 | |
| JUL | 163.4 | |
| AUG | 116.3 | |
| SEPT | 34.3 | |
| OCT | 162.9 | |
| NOV | 84.1 | 10 |
| DEC | 61.3 | 40 |
| 1123.1 |
2016
| mm | CM | |
| JAN. | 30.7 | 18 |
| FEB | 38.9 | 54 |
| MAR | 121.4 | mm |
| April | 15 | cm |
| MAY | 20.6 | rain |
| JUNE | 51.8 | rain |
| JULY | 67.6 | rain |
| AUG | 88.8 | rain |
| SEPT | 52.8 | rain |
| OCT | 86.6 | 4.5 |
| NOV | 39.1 | 25.13 |
| DEC | 34.3 | |
| 647.6 | 66cm |
It was in 2015 that I bought a more accurate rain gauge.
| 2015 | mm | CM |
| Jan. | 8 | 33 |
| February | 38 | |
| March | 11 | 7.5 |
| April | 84 | 2 |
| May | 68 | |
| June | 156 | |
| July | 71 | |
| Aug. | 120.7 | |
| Sept. | 83.9 | |
| Oct | 55.7 | |
| Nov. | 54.1 | |
| Dec | 57.4 | |
| 769.8 | 80.5 |
It was about June, 2014 that I had new and more accurate rain gauge.
 |
| The new gauge is quirky! |
| 2014 | ||
| JAN | 62 | snow |
| FEB | 41.7 | snow |
| MAR | 53.5 | snow |
| APR | 160 | pellets |
| MAY | 166 | mm |
| JUN | 156 | mm |
| JULY | 186 | mm |
| AUG | 185.25 | mm |
| SEPT | 122 | mm |
| OCT | 109 | mm |
| NOV | 15mm | 25.5cm |
| Dec. | 16cm | |
| 1241.45 |

The temperatures of the Great Lakes have a profound effect on our snowfall. You can check out the surface temperatures there.
Ontario flood map
Ontario flood map
USA National Phenology Network
Sunshine is delicious, rain is refreshing, wind braces us up, snow is exhilarating; there is really no such thing as bad weather, only different kinds of good weather.
-John Ruskin, author, art critic, and social reformer (8 Feb. 1819 – 1900)
 |
| 2014 rain |
 |
| 2013 rainfall Compare to Aug. 2012 - 1.77mm! |
- Finding historical data is interesting .
- Canada Tornado Radar
- Traffic cameras SE Ontario
- Fire Ratings in Ontario
- Ontario Road Closures
 |
| My rain gauge (udometer, pluviometer, or ombrometer ). |


No comments:
Post a Comment